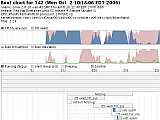
Sample Boot Charts
- Fedora
- SUSE Linux
- Gentoo
- Debian
- Mandriva
- Source Mage Linux
- Conectiva Linux
- KNOPPIX
- Red Hat Enterprise Linux / Xen
Fedora
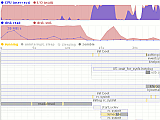
This was the first boot chart created (no disk utilization information yet):
It immediately pinpointed problems in the Fedora Core 3 boot process:
-
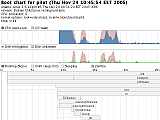
This chart shows the current state, where experiments with early
readaheadand disk utilization are being made. Note that the boot process duration went from 1:38 to 0:48. -
David Zeuthen did a great analysis of the Fedora boot process and included some boot charts.
SUSE Linux
Stephan Kulow <coolo at suse de> has been working on optimizing the SUSE boot process:
Gentoo
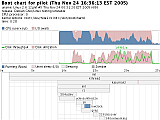
Paul Pacheco <paul pacheco at wavecode com> is working on improving the Gentoo boot process. The following charts display the default Gentoo bootup (1:17) and Paul's improved version (0:37):
Debian
Geoffrey McRae <Geoffrey MCRAE at dewr gov au> managed to improve the boot time of a fully loaded Debian server:
Mandriva
There's a Wiki page dedicated to profiling the Mandriva boot process with bootchart.
Source Mage Linux
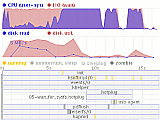
Robert Helgesson <rycee at home se> compared sequential and parallel script execution on Source Mage Linux:
Conectiva Linux
Vagner A. Farias <vfarias at conectiva com br> sent the boot chart for Conectiva Linux:
KNOPPIX
Kuniyasu Suzaki <k suzaki at aist go jp> and the developers of KNOPPIX Japanese edition have managed to reduce the time needed to boot the KNOPPIX 3.7 CD by 60 seconds using
readahead. Boot charts included.
Red Hat Enterprise Linux / Xen
Tim Scully <tim scully at theopenway net> ran bootchart on RHEL4 with the Xen hypervisor:


