About
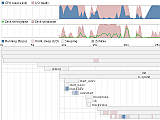
Bootchart is a tool for performance analysis and visualization of the GNU/Linux boot process. Resource utilization and process information are collected during the boot process and are later rendered in a PNG, SVG or EPS encoded chart.
The project started as a response to a challenge posted by Owen Taylor on the Fedora development mailing list:
"The challenge is to create a single poster showing graphically what is going on during the boot, what is the utilization of resources, how the current boot differs from the ideal world of 100% disk and CPU utilization, and thus, where are the opportunities for optimization."
Bootchart provides a shell script to be run by the kernel in the
init phase. The script will run in background and collect
process information, CPU statistics and disk usage statistics from the
/proc file system. The performance data are stored in memory
and are written to disk once the boot process completes.
The boot log file is later processed using a Java application (or the web form) which builds the process tree and renders a performance chart in different formats:
The chart can then be analyzed to examine process dependency and overall resource utilization.
News
- 2006-03-05
SourceForge recently enabled Subversion for source control, and bootchart switched over. Details are available on the download page.
- 2005-06-29
Vincent Caron ported the SVG renderer to Perl. The source code and some samples are available here.

